ßàþþ
PETROLEUM POTENTIAL OF
WADI AL SIRHAN BASIN,
Geology, Seismic, Basin Analysis and Remaining Prospects
![]()
Target Exploration
PO Box 50536 , Arad Kingdom of Bahrain
Tel. +973 36
71 97 96
SUMMARY
Al-Sirhan
area in southeast
Stratigraphy, petrography, diagenesis, and depositional environment are studied for each formation in well WS-3. Also, petrophysical studies including porosity, permeability, water saturation, and hydrocarbon saturation are done using wire line logs for candidate reservoirs within the area. Sequence stratigraphy technique is used to divide the stratigraphic succession within the study area and to locate possible source and reservoir rocks. Total organic carbon analysis is done for two candidate source intervals within Al-Sirhan area. Seismic investigation is also done using seventeen seismic sections that cover almost the central and eastern part of the area. Closures, reserves, and proposed migration pathways of hydrocarbons are studied in order to assess the hydrocarbon potentiality of the study area..
TABLE OF CONTENTS
|
Subject |
Page No. |
|
Table of
contents……………………………………………….. |
II |
|
List of
tables……………………………………………………. |
VII |
|
List of
Figures………….……………………...……………….. |
IX |
|
Execative
Summary…………………………………………. |
XIII |
|
|
|
|
Chapter
one: Introduction……..………………………………... |
1 |
|
1.1
Location…………………………………………………….. |
4 |
|
1.2 Petroleum exploration; an overview………………………... |
8 |
|
1.3 Hydrocarbon indications in |
9 |
|
1.3.1 Oil seepages…………………………………………... |
9 |
|
1.3.2 Asphalt………………………………………………... |
10 |
|
1.3.3 Source Rock…………………………………………………. |
10 |
|
1.4
Previous work……………………………………………… |
12 |
|
1.5 Aims
of study……………………………………………… |
15 |
|
|
|
|
Chapter
two: Regional geology and tectonic setting........……… |
16 |
|
2.1
Regional geology…………………………………………… |
16 |
|
2.1.1 Precambrian…………………………………………... |
16 |
|
2.1.2 Palaeozoic…………………………………………….. |
18 |
|
2.1.3 Mesozoic and Cenozoic……………………………… |
22 |
|
2.2
Tectonic setting…………………………………………….. |
24 |
|
2.3
Geological setting of Sirhan Area………………………….. |
29 |
|
|
|
|
Chapter
three: Methodology……………………………………. |
38 |
|
3.1
Petrography……..………………………………………….. |
38 |
|
3.2 X-ray
diffraction……..……………………………………... |
38 |
|
3.3
Petrophysics………………………………………………… |
40 |
|
3.4 Total
organic carbon………………………………………... |
41 |
|
|
|
|
Chapter
four: Petrography, diagenesis, and reservoir properties. |
44 |
|
4.1
Precambrian rocks………………………………………….. |
46 |
|
4.1.1 Precambrian
volcanics………………………………... |
46 |
|
4.1.2 Umm Ghaddah Formation……………………………. |
48 |
|
4.1.2.1 Mineral
composition……………………………... |
48 |
|
4.1.2.2 Diagenesis……………………………………….. |
50 |
|
4.1.2.3 Clay
mineralogy…………………………………. |
51 |
|
4.1.2.4 Porosity………………………………………….. |
51 |
|
4.1.2.5 Provenance and tectonic
setting…………………. |
53 |
|
4.2 Paleozoic
rocks……………………………………………. |
54 |
|
4.2.1 Cambrian Salib
Formation…………………………… |
54 |
|
4.2.1.1 Mineral
composition……………………………... |
54 |
|
4.2.1.2 Diagenesis……………………………………….. |
55 |
|
4.2.1.3 Clay
mineralogy…………………………………. |
56 |
|
4.2.1.4 Porosity………………………………………….. |
56 |
|
4.2.1.5 Provenance and tectonic
setting…………………. |
56 |
|
4.2.2 Burj Formation……………..………………………… |
57 |
|
4.2.2.1 Tayan
Member…………………………………... |
57 |
|
4.2.2.2 Numayri
Member……………………………….. |
59 |
|
4.2.2.3 Hanneh Member…………………………………. |
65 |
|
4.2.2.4 Source rock
potentiality.………...……………….. |
66 |
|
4.2.2.5 Proposed migration
model…….…………………. |
68 |
|
4.2.2.6 Provenance and tectonic
setting…………………. |
68 |
|
4.2.3 Quweira and Umm Ishrin
Formations……………… |
69 |
|
4.2.3.1 Mineral
composition…………………………….. |
71 |
|
4.2.3.2 Diagenesis……………………………………….. |
72 |
|
4.2.3.3 Clay
mineralogy…………………………………. |
73 |
|
4.2.3.4 Porosity………………………………………….. |
73 |
|
4.2.3.5 Proposed migration
model………………………. |
73 |
|
4.2.3.6 Provenance and tectonic
setting…………………. |
74 |
|
4.2.4 Disi Formation………….…………………………….. |
74 |
|
4.2.4.1 Mineral
composition…………………………….. |
75 |
|
4.2.4.2 Diagenesis……………………………………….. |
75 |
|
4.2.4.3 Clay
mineralogy…………………………………. |
76 |
|
4.2.4.4 Porosity………………………………………….. |
76 |
|
4.2.4.5 Provenance and tectonic
setting ...………………. |
76 |
|
4.2.5 Umm Sahm Formation………….…………………… |
77 |
|
4.2.5.1 Mineral composition…………………………….. |
77 |
|
4.2.5.2 Diagenesis……………………………………….. |
79 |
|
4.2.5.3 Clay
mineralogy…………………………………. |
79 |
|
4.2.5.4 Porosity………………………………………….. |
79 |
|
4.2.5.5 Provenance and tectonic
setting ...………………. |
79 |
|
4.2.6 Hiswa Formation………..……….…………………… |
80 |
|
4.2.6.1 Mineral
composition…………………………….. |
80 |
|
4.2.6.2 Diagenesis……………………………………….. |
82 |
|
4.2.6.3 Clay
mineralogy…………………………………. |
82 |
|
4.2.6.4 Depositional environment
and source potentiality. |
82 |
|
4.2.7 Umm Tarifa Formation………………..……………… |
83 |
|
4.2.7.1 Mineral
composition…………………………….. |
85 |
|
4.2.7.2 Diagenesis……………………………………….. |
85 |
|
4.2.7.3 Clay
mineralogy…………………………………. |
86 |
|
4.2.7.4 Porosity and source
evaluation………………….. |
86 |
|
4.2.7.5 Proposed migration
model………………………. |
86 |
|
4.2.7.6 Provenance and tectonic
setting…………………. |
88 |
|
4.2.8 Batra Formation………………………………………. |
89 |
|
4.2.8.1 Depositional environment
and source evaluation... |
89 |
|
4.2.9 Alna Formation………………………………………. |
91 |
|
4.2.9.1 Mineral
composition……………………………... |
92 |
|
4.2.9.2 Diagenesis……………………………………….. |
93 |
|
4.2.9.3 Clay
mineralogy…………………………………. |
93 |
|
4.2.9.4 Porosity…………………………………………. |
93 |
|
4.2.9.5 Proposed migration
model………………………. |
94 |
|
4.2.9.6 Provenance and tectonic
setting…………………. |
94 |
|
4.3
Mesozoic and Cenozoic rocks……………………………… |
94 |
|
4.3.1 Kurnub sandstone…………………………………….. |
95 |
|
4.3.1.1 Mineral
composition……………………………... |
95 |
|
4.3.1.2 Diagenesis……………………………………….. |
95 |
|
4.3.1.3 Clay
mineralogy…………………………………. |
97 |
|
4.3.1.4 Provenance and tectonic
setting…………………. |
97 |
|
4.3.2 Upper Cretaceous and
Paleogene……………………. |
97 |
|
|
|
|
Chapter
five: Sequence stratigraphy………….………………… |
100 |
|
5.1 Stratigraphic sequences…………………………………….. |
100 |
|
5.1.1 Sequence 1…………………………………………… |
101 |
|
5.1.1.1 Lowstand systems
tract………………………….. |
101 |
|
5.1.1.2 Transgressive systems
tract……………………… |
103 |
|
5.1.1.3 Highstand systems
tract………………………….. |
104 |
|
5.1.2 Sequence 2…………………………………………… |
105 |
|
5.1.2.1 Transgressive systems
tract……………………… |
105 |
|
5.1.2.2 Highstand systems
tract………………………….. |
107 |
|
5.1.3 Sequence 3…………………………………………… |
108 |
|
5.1.3.1 Lowstand systems tract………………………….. |
108 |
|
5.1.3.2 Transgressive and highstand
systems tract………. |
108 |
|
5.1.4 Sequence 4…………………………………………… |
110 |
|
5.1.4.1 Lowstand systems
tract………………………….. |
110 |
|
5.1.4.2 Transgressive and highstand
systems tract………. |
111 |
|
5.1.5 Sequence 5…………………………………………… |
111 |
|
5.1.5.1 Lowstand systems
tract………………………….. |
113 |
|
5.1.5.2 Transgressive and highstand
systems tract………. |
113 |
|
5.1.6 Sequence 6…………………………………………… |
114 |
|
5.1.6.1 Transgressive and highstand
systems tract………. |
114 |
|
5.1.7 Sequence 7…………………………………………… |
115 |
|
5.1.7.1 Transgressive systems
tract……………………… |
115 |
|
5.1.7.2 Highstand systems
tract………………………….. |
117 |
|
5.1.8 Sequence 8…………………………………………… |
117 |
|
5.1.8.1 Transgressive systems
tract……………………… |
118 |
|
5.1.8.2 Highstand systems
tract………………………….. |
118 |
|
5.1.9 Sequence 9…………………………………………… |
119 |
|
5.1.9.1 Lowstand systems
tract………………………….. |
119 |
|
5.1.9.2 Transgressive systems
tract……………………… |
120 |
|
5.1.9.3 Highstand systems
tract………………………….. |
120 |
|
5.1.10 Sequence 10………………………………………… |
121 |
|
5.1.10.1 Transgressive systems
tract……….....………… |
122 |
|
5.1.10.2 Highstand systems tract………………..……….. |
122 |
|
5.2 Eustasy versus
tectonics……………………………….. |
123 |
|
|
|
|
Chapter
six: SEISMIC INTERPRETATION…………………... |
125 |
|
6.1
Seismic data………………………………………………… |
125 |
|
6.2
Seismic work description…………………………………... |
127 |
|
6.2.1 Tying logs to seismic lines…………………………… |
127 |
|
6.2.2 Tracing reflectors and generating
maps……………… |
127 |
|
6.2.3 Target reflectors………………………………………. |
128 |
|
6.3
Seismic data interpretation…………………………………. |
129 |
|
6.3.1 Precambrian rocks……………………………………. |
134 |
|
6.3.2 Salib Formation………………………………………. |
134 |
|
6.3.3 Hiswa Formation……………………………………... |
135 |
|
6.3.4 Umm Tarifa
Formation……………………………….. |
137 |
|
6.3.5 Batra Formation………………………………………. |
138 |
|
6.3.6 Alna Formation………………………………………. |
139 |
|
6.4 Time
and depth maps………………………………………. |
139 |
|
6.4.1 TWT structure map for the top of
Salib Formation….. |
139 |
|
6.4.2 3-D depth map for the top of
Salib Formation……….. |
140 |
|
6.4.3 TWT structure map for the top of
Hiswa Formation…. |
141 |
|
6.4.4 3-D depth map for the top of
Hiswa Formation……… |
143 |
|
6.4.5 TWT map for the top of Umm Tarifa
Formation…….. |
143 |
|
6.4.6 3-D depth map for the top of Umm
Tarifa Formation... |
143 |
|
6.4.7 TWT structure map for the top of
Alna Formation…... |
146 |
|
6.4.8 3-D depth map for the top of Alna
Formation………... |
149 |
|
6.5 |
149 |
|
6.5.1 Cratonization of the Arabian
Shield………………….. |
149 |
|
6.5.2 Najd Fault
cycle...…………………………………….. |
150 |
|
6.5.3 Nubian cycle I………………………………………… |
153 |
|
6.5.4 Nubian cycle II and Hoggar cycle..………………….. |
154 |
|
6.5.5 Nubian cycle III………………………………………. |
155 |
|
6.5.6 Hercynian cycle………………………………………. |
155 |
|
6.5.7 Jurhom and Neotethys
cycles……………..………….. |
156 |
|
6.5.8 Arabian Plate cycle…………………………………… |
157 |
|
|
|
|
Chapter
seven: HYDROCARBON PROSPECTIVITY……….. |
158 |
|
7.1 The
Cambrian play system…………………………………. |
158 |
|
7.1.1 Source rock………………………………………….. |
158 |
|
7.1.2 Source rock
maturity…………………………………. |
159 |
|
7.1.3 Reservoir rock……………………………………….. |
163 |
|
7.1.4 Seal rock……………………………………………… |
167 |
|
7.1.5 Trap styles..………………………………………….. |
167 |
|
7.1.5.1 Traps related to tensional
faults………………….. |
167 |
|
7.1.5.2 Traps related to
compactional anticlines………… |
169 |
|
7.1.6 Closures……………………………………………… |
171 |
|
7.1.6.1 Closure 1………………………………………… |
171 |
|
7.1.6.2 Closure 2………………………………………… |
171 |
|
7.1.6.3 Closure 3………………………………………… |
174 |
|
7.1.6.4 Closure 4………………………………………… |
174 |
|
7.1.6.5 Closure 5………………………………………… |
175 |
|
7.1.6.6 Closure 6………………………………………… |
175 |
|
7.1.6.7 Closures 7, 8, and
9.…………………………..… |
178 |
|
7.1.6.8 Closures shown only on
seismic sections.……… |
178 |
|
7.1.6.9 Other fault accompanied
closures.………….…… |
179 |
|
7.1.7 Reserve
calculations……………………..…………… |
179 |
|
7.2 The
Ordovician-Silurian play system….…………………… |
181 |
|
7.2.1 Source rock………………………………………….. |
181 |
|
7.2.2 Source rock
maturity…………………………………. |
184 |
|
7.2.3 Reservoir rock……………………………………….. |
186 |
|
7.2.4 Seal rock……………………………………………… |
187 |
|
7.2.5 Trap styles..………………………………………….. |
187 |
|
7.2.6 Closures………………………………………………. |
188 |
|
7.2.6.1 Closure 1………………………………………… |
188 |
|
7.2.6.2 Closure 2………………………………………… |
188 |
|
7.2.6.3 Closure 3………………………………………… |
189 |
|
7.2.6.4 Closure 4………………………………………… |
190 |
|
7.2.6.5 Closure 5………………………………………… |
190 |
|
7.2.6.6 Closure only within seismic
sections.…………… |
191 |
|
7.2.7 Reserve
calculations……………………..…………… |
192 |
|
7.3 The
Silurian play system…………..……………………….. |
192 |
|
7.3.1 Source rock………………………………………….. |
192 |
|
7.3.2 Source rock
maturity…………………………………. |
194 |
|
7.3.3 Reservoir rock……………………………………….. |
194 |
|
7.3.4 Seal rock……………………………………………… |
195 |
|
7.3.5 Trap styles..………………………………………….. |
195 |
|
7.3.6 Closures………………………………………………. |
195 |
|
|
|
|
Chapter
eight: Geohistory analysis……………………………... |
196 |
|
8.1
Sediment accumulation rates……………………..………… |
196 |
|
8.2 Eroded thickness
at the Late Palaeozoic unconformity…..… |
199 |
|
8.3
Subsidence history…………………………………………. |
203 |
|
8.3.1 Step one: Sediment
accumulation……………………. |
203 |
|
8.3.2 Step two:
Decompaction…………………………….. |
203 |
|
8.3.3 Step three:
Paleobathymetry………………………….. |
206 |
|
8.4
Calculating tectonic subsidence………………………......... |
210 |
|
8.5
Interpretation……………………………………………….. |
211 |
|
8.3.1 Time span 550 to 508 My……………………………. |
212 |
|
8.3.2 Time span 508 to 494 My……………………………. |
213 |
|
8.3.3 Time span 494 to 483 My……………………………. |
213 |
|
8.3.4 Time span 483 to 420 My……………………………. |
214 |
|
8.3.5 Time span 420 to 125 My……………………………. |
215 |
|
8.6
Geohistory analysis using software FLEXDECOMP…....… |
216 |
|
|
|
|
Discussion………………………………………………………. |
222 |
|
Conclusions……………………………………………………. |
225 |
|
Recommendations……………………………………………… |
229 |
|
Plates…………………………………………………………… |
230 |
|
References……………………………………………………… |
243 |
|
Arabic
abstract…………………………………………………. |
251 |
LIST OF TABLES
|
Table No. |
Table title |
Page No. |
|
1.1 |
Wadi Sirhan Wells Data (modified after Andrews et al., 1991 and NRA, 2004). |
7 |
|
2.1 |
Lithostratigraphy of
the Paleozoic rocks in |
20 |
|
3.1 |
Distribution of core and cutting samples with depth in well WS-3. |
39 |
|
3.2 |
Rock matrix values for the major types of rocks that are used in the petrophysical calculations. |
42 |
|
4.1 |
TOC values for samples from the Burj Formation in well WS-3. |
67 |
|
4.2 |
TOC values for samples from the Hiswa Formation in well WS-3. |
84 |
|
7.1 |
Crystallinity index (CI), sharpness ratio
(SR), and equivalent vitrinite reflectance for samples from Burj Formation. |
162 |
|
7.2 |
Closures of the Cambrian play system and its oil reserves. |
182 |
|
7.3 |
Crystallinity index (CI), sharpness ration
(SR), and equivalent vitrinite reflectance values for samples from Batra and
Hiswa Formations. |
185 |
|
7.4 |
Closures of the Ordovician-Silurian play
system and its oil reserves. |
193 |
|
8.1 |
Thickness and sediment-accumulation rates for
all the formations in wells WS-2, WS-3, WS-4, and WS-10. |
198 |
|
8.2 |
Age of the beginning of erosion and eroded
thicknesses at the Hercynian Orogeny in all studied wells (after Guidish et al.,
1985). |
201 |
|
8.3 |
Idealized initial porosity and lithology
constant for different lithologies. |
207 |
LIST OF FIGURES
|
Figure No. |
Figure title |
Page No. |
|
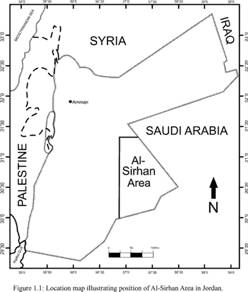
1.1 |
Location map
illustrating position of Al-Sirhan Area in |
2 |
|
1.2 |
Map of |
3 |
|
1.3 |
Arial photo
illustrating the Azraq - Sirhan Area in |
5 |
|
1.4 |
Well locations in the Sirhan Area. |
6 |
|
2.1 |
The Najd Rift System Before 570 Ma prior to the initiation of the Najd Strike Slip System (modified after Knort, 2001). |
17 |
|
2.2 |
Pre-Hercynian
distribution of the Paleozoic rocks in the surface And subsurface of |
23 |
|
2.3 |
Location of Jordan relative to he Arabian Plate and Arabian Nubian Shield (modified after Coleman 1973). |
25 |
|
2.4 |
Columnar section of Basement, Salib, and Burj Formations in well WS-3 (modified after Paleoservices 1987). |
31 |
|
2.5 |
Columnar section of Um Ishrin, Disi, Um Sahm, and Hiswa Formations in well WS-3 (modified after Paleoservices 1987). |
32 |
|
2.6 |
Columnar section of Dubaydib, Mudawwara, Khushsha Formations in well WS-3 (modified after Paleoservices 1987). |
34 |
|
2.7 |
Columnar section of the Mesozoic and Cenozoic Formations in well WS-3 (modified after Paleoservices 1987). |
36 |
|
4.1 |
Triangle plots used in classifying Al-Sirhan sandstones. |
45 |
|
4.2 |
Lava flows extending for a wide area in Al-Sirhan basin, line S-39. |
47 |
|
4.3 |
Columnar section of Basement, Umm Ghaddah, and Salib Formations in well WS-3. |
49 |
|
4.4 |
Representative XRD traces of the clay fraction from Umm Ghaddah Formation (depth 4215 m) in well WS-3. |
52 |
|
|
|
|
|
Figure No. |
Figure title |
Page No. |
|
4.5 |
Columnar section of Burj Formation in Al-Sirhan Area, well WS-3. |
58 |
|
4.6 |
Columnar section of Quweira, Umm Ishrin, and Disi Formations in Al-Sirhan Area, well WS-3. |
70 |
|
4.7 |
Columnar section of Umm Sahm, Hiswa, and Dubaydib Formations in Al-Sirhan Area, well WS-3. |
78 |
|
4.8 |
Distribution of the
thickness of several formations within |
81 |
|
4.9 |
Variation of porosity
of Umm Tarifa Formation and TOC content of the lower hot shale of Batra
Formation in |
87 |
|
4.10 |
Columnar section of Batra and Alna Formations in well WS-3. |
90 |
|
4.11 |
Columnar section of the Mesozoic and Cenozoic formations in well WS-3. |
96 |
|
5.1 |
Detailed key surfaces, systems tracts, sequences, and parasequences of Umm Ghaddah, Salib, and Burj Formations in Al-Sirhan Area, well WS-3. |
102 |
|
5.2 |
Sequence stratigraphic correlation of the Palaeozoic sequence in Al-Sirhan Area. |
106 |
|
5.3 |
Detailed key surfaces, systems tracts, sequences, and parasequences of Quweira, Umm Ishrin, Disi, Umm Sahm, and Hiswa Formations in Al-Sirhan Area, well WS-3. |
109 |
|
5.4 |
Sequence stratigraphic correlation of the Palaeozoic sequence in Al-Sirhan Area. |
112 |
|
5.5 |
Detailed key surfaces, systems tracts, sequences, and parasequences of Umm Tarifa, Batra, and Alna Formations in Al-Sirhan Area, well WS-3. |
116 |
|
6.1 |
Base map showing different seismic lines used in the study area. |
126 |
|
|
|
|
|
Figure No. |
Figure title |
Page No. |
|
6.2 |
Seismic line S-44 showing different interpreted reflectors, small horst structure closures, and different types of faults. |
130 |
|
6.3 |
Seismic line S-45 showing different interpreted reflectors, with several closures including horst structures, broad compactional anticlines, and different types of faults. |
131 |
|
6.4 |
Time structure map for the top of Salib Formation. |
133 |
|
6.5 |
Seismic line S-61 showing different interpreted reflectors, general dipping trend of the strata towards northeast, downfaulted blocks of the Precambrian rocks overlain by increased thicknesses of Salib Formation, and small horst structure closures. |
136 |
|
6.6 |
3-D depth maps for the top of Salib and Hiswa Formations showing main closures within Salib Formation. |
142 |
|
6.7 |
Time structure map for the top of Hiswa Formation. |
144 |
|
6.8 |
Time structure map for the top of Umm Tarifa Formation. |
145 |
|
6.9 |
3-D depth maps for the top of Umm Tarifa and Alna Formations showing the proposed closures. |
147 |
|
6.10 |
Time structure map for the top of Alna Formation. |
148 |
|
6.11 |
Evolution of Al-Sirhan basin during the different depositional cycles. |
151, 152 |
|
7.1 |
X-ray diffractograms showing different crystallinity indices measured for Burj, Hiswa, and Batra Formations. |
161 |
|
7.2 |
Flow chart for the calculation of water saturation of the formation (Sw) and permeability (K). |
164 |
|
7.3 |
Theoretical
configuration of traps related to tensional faults within |
168 |
|
7.4 |
Theoretical
configuration of traps related to tensional faults (horst structures) within |
170 |
|
7.5 |
Seismic line S-39 showing closure-1 and closur-10d within the top of Salib Formation and closure-1 and closure-6f within the top of Umm Tarifa Formation. |
172 |
|
|
|
|
|
Figure No. |
Figure title |
Page No. |
|
7.6 |
Seismic line S-62 showing closure-1 and
closure-2 within the top of Salib and Umm Tarifa Formations. |
173 |
|
7.7 |
Seismic line S-100 showing closur-5 within the top of Salib Formation and closure 6d within Umm Tarifa Formation. |
176 |
|
7.8 |
Seismic line S-4 showing different interpreted reflectors and closure-5 in Salib Formation and 3 in Umm Tarifa Formation. |
177 |
|
7.9 |
Flow chart for calculating oil reserves from wire line logs (after Asquith and Gibson, 1982). |
180 |
|
8.1 |
Subsidence history curves for Wells WS-3 and WS-10. |
204 |
|
8.2 |
Subsidence history curves for Wells WS-2 and WS-4. |
205 |
|
8.3 |
Present thickness, initial thickness, and restored thickness for the stratigraphic units o wells WS-2 and WS-3. |
208 |
|
8.4 |
Present thickness, initial thickness, and restored thickness for the stratigraphic units o wells WS-4 and WS-10. |
209 |
|
8.5 |
Modeling the
lithological evolution of |
217 |
|
8.6 |
Present thickness, initial thickness, and restored thickness for the stratigraphic units of wells WS-3 and WS-10 using software FLEXDECOMP. |
220 |
The report is immediately available from Target Exploration
or contact:
Target Exploration
PO Box 50536 , Arad Kingdom of Bahrain
Tel. +973 36
71 97 96